What is a kelvin wave?
10-29-2026 [Siri chat]
A Kelvin wave is a massive, slow-moving pulse of warm water that travels across the ocean or along coastlines. These waves are planetary gravity waves that can stretch thousands of miles and are a key part of the El Niño climate cycle. Unlike typical ocean waves, Kelvin waves do not break on shore; instead, they act like a bulge of water that gradually raises the baseline sea level as it passes.
Formation and Movement
Kelvin waves typically form in the western equatorial Pacific when trade winds weaken or reverse, allowing warm surface water to slosh eastward. They travel underwater along the equator at about 5 to 6 miles per hour, taking two to three months to cross the Pacific. When the wave reaches the coast of South America, it splits and travels north and south along the American coastlines as a coastally trapped wave.
Impacts on the Ocean
As a Kelvin wave moves, it thickens the warm upper layer of the ocean and pushes the thermocline—the boundary between warm surface water and cold deep water—deeper. This process temporarily raises local sea levels by 6 to 12 inches or more. The waves also suppress the upwelling of cold, nutrient-dense water, which can disrupt marine ecosystems and reduce the growth of phytoplankton.
Types of Kelvin Waves
There are two main types of Kelvin waves:
- Equatorial Kelvin waves These waves travel eastward along the equator and are driven by shifts in trade winds.
- Coastal Kelvin waves Also known as coastally trapped waves, these travel along shorelines and are held against the coast by the Earth’s Coriolis effect.
Origins
The phenomenon is named after Scottish engineer, mathematician, and physicist William Thomson, Baron Kelvin, who first described these waves in 1879.
Keep in mind, I’m an assistant powered by AI and may make mistakes. Always verify important details.
Are kelvin waves seasonal or is something special occurring this year?
Kelvin waves are regular events that typically occur multiple times a year, but their frequency and intensity are significantly heightened this year due to a strong El Niño. While these waves usually cause only small, difficult-to-observe changes in sea surface height, the current El Niño conditions have triggered a powerful series of coastally trapped Kelvin waves. These waves are currently raising sea levels along the North American West Coast by up to a foot, increasing the risk of coastal flooding and erosion as they combine with seasonal high tides and winter storms.
Why This Year is Different
During a typical year, two to four downwelling equatorial Kelvin waves might cross the Pacific with minimal impact. However, 2026 is experiencing a record-strong El Niño, which alters trade winds and allows massive amounts of warm water from the western Pacific to surge eastward.
This has resulted in a “barrage” of successive Kelvin waves. Key differences this year include:
- Elevated Sea Levels: The current waves are temporarily raising baseline sea levels by 6 to 12 inches along the California coast.
- Compounding Threats: The arrival of these waves is coinciding with seasonal king tides and early winter storms, significantly increasing the risk of coastal erosion and flooding.
- Successive Waves: Scientists have tracked multiple waves since May, with new waves continuing to form and travel up the West Coast into the fall and winter.
Normal vs. El Niño Years
| FEATURE | TYPICAL YEAR | 2026 (EL NIÑO YEAR) |
| Frequency | 2 to 4 minor waves | A continuous series of 5 or more strong waves |
| Sea Level Impact | Minimal; difficult to observe | Raised by 6 to 12 inches for weeks or months |
| Primary Driver | Routine shifts in equatorial winds | Weakened or reversed trade winds from strong El Niño |
Is there a connection with the lunar tidal cycle?
Yes, there is a direct connection between Kelvin waves and the lunar tidal cycle, as Kelvin waves are a fundamental component of how tides move through the ocean. While the gravitational pull of the Moon and Sun generates the tidal force, the actual movement of the tide along coastlines and through ocean basins often takes the physical form of a coastal Kelvin wave. Additionally, the large-scale Kelvin waves associated with El Niño can significantly amplify the effects of the lunar tidal cycle by raising the baseline sea level, making normal high tides and king tides much more destructive.
How Kelvin Waves Shape the Tides
When the Moon’s gravity pulls on the Earth, it creates a tidal bulge. As the Earth rotates, this bulge travels across the ocean as a massive, shallow-water wave. When this tidal wave encounters a coastline or a narrow basin (like the North Sea or an estuary), the Earth’s rotation (the Coriolis effect) traps the wave against the coast, transforming it into a coastal Kelvin wave.
These tidally driven Kelvin waves are responsible for several key tidal phenomena:
- Amphidromic Systems: Kelvin waves traveling along a coast can reflect and interfere with one another, creating central points in the ocean (amphidromes) where the tidal range is zero, while the tide rotates around them.
- Asymmetrical Tides: Because Kelvin waves hug the coast on their right in the Northern Hemisphere (and their left in the Southern), the tidal range is often noticeably higher on one side of a channel or estuary than the other.
The El Niño Connection
While daily tides are driven by the Moon, the massive, climate-driven Kelvin waves currently moving up the West Coast are driven by wind and atmospheric changes from El Niño.
However, these two forces are currently on a collision course:
- The Baseline Lift: The current El Niño Kelvin waves are raising the baseline sea level by up to a foot.
The Lunar Multiplier: When the lunar cycle brings “king tides” (exceptionally high tides occurring when the Earth, Moon, and Sun align), this extra foot of water from the Kelvin wave can push the ocean over the edge, leading to severe coastal flooding and erosion.
Can this be summarized in a visualization—chart, diagram, graphic?
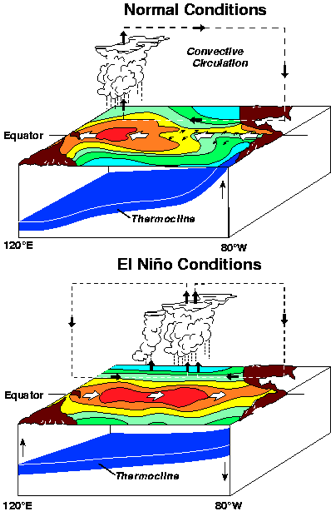
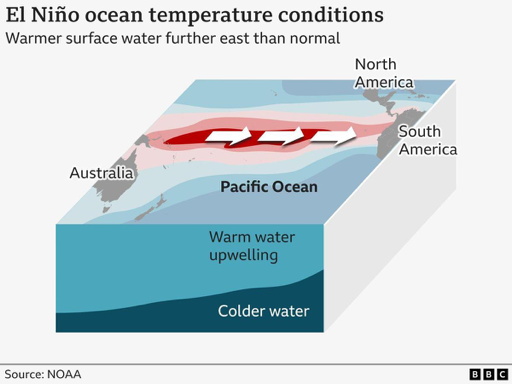
While I cannot generate a custom diagram, I have found several visualizations from scientific organizations like NOAA and the BBC that illustrate how Kelvin waves and El Niño conditions interact. These graphics generally show the shift in trade winds and the massive “slosh” of warm water that travels across the Pacific toward the Americas.
What These Visualizations Typically Show
If you are looking to understand the mechanics of a Kelvin wave through a diagram, here are the key elements usually depicted:
- The Wind Shift: Normal conditions show strong trade winds pushing warm water into a “pile” in the western Pacific. El Niño diagrams show these winds weakening or reversing.
- The Warm Water “Slosh”: A cross-section of the ocean showing a massive, lens-shaped bulge of warm water (the Kelvin wave) traveling eastward along the equator beneath the surface.
- The Coastal Split: Upon hitting the coast of South America, the wave splits into two coastally trapped waves traveling north and south, which is what ultimately impacts sea levels along the West Coast.
The Thermocline: A distinct line showing the boundary between warm surface water and cold deep water, which gets pushed much deeper as the Kelvin wave passes.
How long is this impact projected to last this year (or even into 2027)?
The impacts of the current “Super El Niño” and the associated barrage of Kelvin waves are projected to last well into early 2027. Forecasters from the World Meteorological Organization (WMO) and NOAA indicate a near-100% likelihood that this exceptionally strong El Niño will persist through at least February 2027, with broader climate impacts continuing into the spring and early summer. While individual Kelvin waves typically subside before the overall El Niño peaks, several more waves are expected to arrive through the fall and winter, keeping coastal sea levels elevated during the most vulnerable months of the year.
Projected Timeline of Impacts
The current climate event is expected to follow this general trajectory:
- Fall/Winter 2026: Successive Kelvin waves will continue to elevate baseline sea levels along the West Coast by 6 to 12 inches. This period carries the highest risk for coastal flooding, as these waves will coincide with seasonal king tides in November and December.
- December 2026 – January 2027: The El Niño phenomenon is expected to reach its peak intensity.
- February 2027: The WMO forecasts a nearly 100% chance that strong El Niño conditions will remain firmly established through this month.
- Spring 2027: While the event is expected to begin weakening rapidly after its peak, moderate-to-strong El Niño conditions (and their associated weather disruptions) are projected to linger through the spring and potentially into early summer.
Why This Event is Historically Significant
Forecasters are noting that this is shaping up to be one of the strongest El Niño events since record-keeping began. Sea surface temperatures in the tropical Pacific are projected to reach unprecedented anomalies—potentially up to 3.7°C (6.7°F) above normal—surpassing the records set during the major 2015–2016 event.
This has been a useful overview 🙂
I’m glad I could help! If you have any more questions about weather phenomena, climate patterns, or anything else, just let me know.